(indicator of the average life expectancy) is the most important integral demographic indicator characterizing the mortality rate of the population. Simply put, it denotes the average number of years of the future life of a person who has reached a given age, and is the final indicator of the mortality table. Generally, “life expectancy” refers to the life expectancy at birth, that is, at age 0 years.
- 1 Evolution of life expectancy
- 1.1 Dynamics
- 1.2 Russia
- 2 Notes
- 3 See also
- 4 Links
Evolution of life expectancy
Dynamics
Because of the high infant mortality rate, the average life expectancy in the Ancient Mediterranean ranged from 30 years in Gaul to 40 years in Hellas, Egypt and Parthia, possibly up to 50 years. The Middle Ages rarely exceeded 30 years on average. Until 1990, life expectancy was the highest in Europe, especially in Scandinavia (20 years higher than in Russia and 10 years higher than in Great Britain). Since 1990, North America has been the leader in longevity. The highest rate of increase in life expectancy in Asia, the lowest in Eastern Europe and Central Asia. But even in Central Asia, the average life expectancy is higher than in Russia (Russia - 66 years, Kyrgyzstan - 69 years, the world average - 67 years).
Since 1920, the main factor that has increased the average life expectancy has been the successful fight against child mortality.
In 1950, the probability of living to the age of 80-90 years averaged 15-16% for women and 12% for men.
Beginning in 1970, progress in maintaining the life of the elderly began to play a major role in increasing life expectancy.
In 2002, the probability of living to the age of 80-90 years averaged 37% for women and 25% for men.
Because infant mortality rates were very high until recently, it increased with age as you got older. For example, the table shows life expectancy in Medieval Britain - 30 years. An aristocrat man in the same period, if he lived to the age of 21, could expect to live:
- 1200-1300: 45 years old (up to age 66)
- 1300-1400: 34 years (up to age 55) (life expectancy decreased due to plague epidemics during this period);
- 1400-1500: 48 years old (up to age 69)
- 1500-1550: 50 years (up to age 71).
Currently in developed countries typical life expectancy at birth is approximately 78 years for males and 82 years for females, with little variation. These countries are characterized by very low "premature" mortality (infant mortality and mortality among people of working age.) For example, in France in 1999, mortality statistics were such that the probability of not living to the age of 20 was only 1.2% for newborn boys and 0.75 % for girls. 11.0% and 4.7%, respectively, did not survive to 55 years of age. For comparison, in Russia, at the same time, the probability of not living to 55 for a newborn boy was 28.5%.
| Average life expectancy by countries of the world in different eras. | Great Britain | Germany | Russia | USA | France | Japan | The Roman Empire | Worldwide |
|---|---|---|---|---|---|---|---|---|
| Mesolithic 17-12 thousand years BC vr.) | 30 | |||||||
| Neolithic (12-6 thousand years BC) | 21 | |||||||
| Copper Age (6-5 thousand years BC) | 33 | |||||||
| Bronze and Iron Age (5-2 thousand BC) | 36 | |||||||
| 200 BC | 21 | |||||||
| XIII century | 35 | |||||||
| XVI century | 33-38 | |||||||
| XVII century | 34-39 | |||||||
| 1701-1750 | 32-38 | 50-51 | ||||||
| 1751-1800 | 35-39 | 44-56 | 26-36 | |||||
| 1801-1850 | 38-50 | 37-38 | 40-50 | 39-43 | 32-42 | 36-38 | ||
| 1851-1900 | 41-50 | 37-47 | 40-50 | 37-50 | 40-47 | 36-44 | ||
| 1901-1950 | 47-69 | 44-67 | 32-58 | 49-68 | 46-67 | 37-61 | ||
| 1951-2000 | 69-77 | 68-77 | 59-69 | 69-76 | 67-78 | 62-80 | 47-66 |
In Russia
Life expectancy in Russia Total life expectancy for Russia. Data for 1985-2011- 1985 - 69,26
- 1986 - 70,13
- 1987 - 70,13
- 1988 - 69,9
- 1989 - 69,57
- 1990 - 69,20
- 1991 - 69,01
- 1992 - 67,89
- 1993 - 65,14
- 1994 - 63,98
- 1995 - 64,64
- 1996 - 65,89
- 1997 - 66,64
- 1998 - 67,02
- 1999 - 65,93
- 2000 - 65,27
- 2001 - 65,29
- 2002 - 64,82
- 2003 - 65,07
- 2004 -
- 2005 - 65,30
- 2006 - 66,80
- 2007 -
- 2008 - 67,90
- 2009 - 69,00
- 2010 -
- 2011 - 70,20
- 2012 -
- 2013 - 71,14
Average life expectancy of the population of Russia in 1896-1897 was 29.43 years for men, 31.69 for women. According to this indicator, Russia lagged noticeably behind many European countries, especially from Scandinavia. The life expectancy of men in Russia was 21 years lower than in Sweden and Norway, for women this difference was even higher - 22 years.
In 1940, life expectancy in the USSR was 38.6 years for men and 43.9 for women. In the RSFSR, the life expectancy for men was 37.5 years, for women - 41.9 years, which was more than 20 years less than the average life expectancy in England at that time. By 1950, life expectancy in the RSFSR increased markedly and amounted to 54 years for men and 62 years for women.
By the mid-sixties of the twentieth century, Russia (USSR) managed to practically eliminate its lag in life expectancy, which until World War II remained in Russia significantly below the level of Western countries. From that time on, the gap began to increase again. In the second half of the 1980s, during the Gorbachev anti-alcohol campaign, mortality decreased and, accordingly, life expectancy increased.
A significant increase in mortality in the 1990s, as well as a decrease in the total fertility rate below the level of simple reproduction, led to a long-term decline in the population for the first time in Russian history; therefore, the losses from supermortality in the 1990s are compared by many with losses during the Great Patriotic War. Many developed countries also live in the depopulation regime, for example, Germany, Italy, Bulgaria, Hungary, Czech Republic, Sweden and a number of others. The difference between Russia and Western European countries is the structure of mortality by causes of death. In Russia, many times more than in other developed countries, mortality at working age from diseases of the circulatory system and external causes - injuries, poisoning, murders, suicides.
According to the UN, from 2003 to 2008, life expectancy in Russia at birth has steadily increased (from 64.9 years in 2003 to 65.4 years in 2008). According to Rosstat, life expectancy in Russia in 2008 was 67.9 years (61.8 for men and 74.2 for women). According to the CIA World Book of Facts, this indicator in Russia practically does not change in last years and was 66.39 years in 2004, and in 2011 - 66.29 years.
In February 2010, Deputy Prime Minister of Russia Alexander Zhukov, at a meeting in the Government of the Russian Federation on the results of the implementation of national projects in 2009, said that in 2009 life expectancy increased to 69 years: “For several years now, the average life expectancy in Russia has been growing, - noted Zhukov. “In 2009, this indicator increased by more than 1.2 years and averaged over 69 years for both men and women.” According to him, the increase in life expectancy is the success of priority national projects: “Results of the implementation of national projects in 2009 can be called quite successful ... This follows from the indicators that have been achieved, in a number of areas we have quite good results. " According to Zhukov, this primarily concerns national project "Health" and population policy.
On October 15, 2011, Russian President Dmitry Medvedev, at a meeting with his supporters, said, and on December 22, 2011, in a message from the President to the Federal Assembly, repeated that the average life expectancy in Russia is 69 years, which, in his opinion, exceeds all Soviet indicators, and the life of women is 74 years. According to the ruling United Russia party, reflected in its program address, in 2013 the average life expectancy in Russia will exceed 70 years. On November 1, 2011, Minister of Health and Social Development of Russia Tatyana Golikova, with reference to the average forecast of Rosstat, reported that by 2020 the average life expectancy in Russia will be 71.8 years, including 77.3 years for women and 77.3 for men. 66.2 years.
On January 20, 2012, Russian Prime Minister Vladimir Putin announced that the average life expectancy in Russia for both sexes exceeded 70 years. According to the demographer A. G. Vishnevsky, “the increase in life expectancy for both sexes to 70 years is a rather modest result. According to UN experts, in 2010-2015 57% of the world's population will have a life expectancy of 70 years or more for both sexes. " This indicator should not be confused with the survival period - the average number of years that a person lives after reaching retirement age. In Russia in 2011 this indicator was 15 years for men and 24 years for women in Russia.
Notes
- http://www.who.int/healthinfo/paper09.pdf
- For a list of literature (18 sources), see the website of the Financial University under the Government of the Russian Federation in the article: A. N. Zubets. Quantitative estimates in history (tools for cliometry). Financial University, 2014.
- www.demoscope.ru/weekly/ssp/sng_e0.php
- 15 newly independent states. Life expectancy at birth, 1950-2006
- Rosstat. Life expectancy at birth
- HEALTH OF RUSSIANS FOR 100 YEARS. B. B. Prokhorov
- 1 2 Victory Price: Collaboration: Causes and Consequences - Part II, Program Sound Recording - 7:30 am to 8:30 am.
- Life expectancy at birth, 1950-2005, males, Russia - Demoscope Weekly
- Life expectancy at birth, 1950-2005, females, Russia - Demoscope Weekly
- Frans Mele, Vladimir Shkolnikov, Veronique Hertrish, Jacques Vallen POPULATION & SOCIETY
- 1 2 RYVAKOVSKY Leonid Leonidovich - Doctor of Economics, Professor, Chief Researcher of the Institute of Socio-Political Research of the Russian Academy of Sciences DEMOGRAPHIC FUTURE OF RUSSIA AND MIGRATION PROCESSES
- Demographic modernization of Russia: 1900-2000 Edited by Anatoly Vishnevsky "New history" series Moscow, New publishing house, 2006, 601 pages
- Life expectancy at birth (inaccessible link from 13-05-2013 (734 days) - history) (eng.)
- Central Statistical Database
- CIA - The World Factbook - Life expectancy at birth
- 1 2 Average life expectancy in Russia has increased by more than one year (inaccessible link from 13-05-2013 (734 days) - history) // AMI-TASS, February 17, 2010
- President Medvedev's pre-election statement and his subsequent message to the Federal Assembly are obviously somewhat at odds with the World Bank data for Russia, according to which in 1986 and 1987 the average life expectancy was 69.4 years, and in 1987 - 69.5
- Federal State Statistics Service. Demographic Yearbook of Russia 2009. Life expectancy at birth. 1986-1987 - 70.13 years old
- Lead. Ru: Dmitry Medvedev's meeting with supporters. Full text
- Message from the President to the Federal Assembly
- http://er.ru/party/address/
- A forum for mature people "50 plus" has started in Moscow - Marina Gritsyuk - "50 plus new life»- Rossiyskaya Gazeta - a forum for sp ...
- Putin: average life expectancy in Russia has exceeded 70 years - Rosbalt
- We are still far from European life expectancy Demoscope Weekly № 535-536 December 10 - 31, 2012
- The Pension Fund miscalculated in its favor / Economics / Nezavisimaya Gazeta
see also
- List of countries by life expectancy
- Life span of plants and animals
Links
- Dictionary of demographic terms.
- World Health Organization.
- Life expectancy statistics and services on the WolframAlpha project.
| Longevity | |
|---|---|
| Terminology | Maximum Life Extension Life Extension Life expectancy Immortality (Biological · Eternal youth · Immortality test) Agelessness A hundred-year-old person Ultra-longevity Cognitive epidemiology |
| Problems | Consumerism and longevity Unverified 115-year-olds longevity Myths about longevity List of people who have allegedly lived for more than 130 years |
| Records | Centenarians (living · by year of birth · by country · living by country) List of oldest people in the world (male to female) List of longest marriages List of oldest twins List of oldest trees List of oldest dogs · Oldest WWI veterans |
| see also | Gerontology Immortalism Human aging Biodemography of human longevity Biological aging FOXO3 Immortality in popular culture |
Life Expectancy Information
Life expectancyLife expectancy
Life Expectancy Information Video
Life expectancy View topic.
Life expectancy what, Life expectancy who, Life expectancy explanation
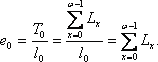
Average life expectancy.The number of people living can also be interpreted as the number of person-years lived by the whole generation of those born in the age interval " x ". Then, therefore,
Figure 6.4. Life lines l x male and female population of the USSR, 1926-1927, 1958-1959, 1986-1987
generation of born l 0 live in the first year of life (i.e. at age 0) L 0 years, in the 2nd year - L iyears, on the 3rd - l 2 years, etc., but in total:
where T 0 - number of man-years that to belive this generation of born.
If this sum of man-years is divided by the initial size of the generation, i.e. by the number of births l 0 , then we get a very important social indicator, which is called the indicator of average life expectancy.
Average life expectancyis the number of years that one person will live on average from a given generation of births, provided that throughout the life of this generation, mortality in each age group will remain unchanged at the level of the reference period.
Life expectancy is calculated for newborns (or otherwise they say - life expectancy at birth) and for those who have reached a certain age "X".
In the form of formulas, the calculation of both averages can be presented as follows.
For newborns:
 (6.5.9)
Since, when calculating the average life expectancy for newborns, the basis of the mortality table l 0 = 1, it can be omitted, and finally this indicator is expressed as the sum of the numbers living in the life interval from the birth of a generation to its complete disappearance.
For people who have reached a certain age " x ", The calculation differs only in that the number of survivors "X", the denominator of the fraction is already less than 1 and cannot be omitted.
 (6.5.10)
Average life expectancy in Russia and its dynamics
According to the State Statistics Committee of Russia, the average life expectancy in the country in 1997 was 60.89 years for men and 72.75 years for women. After a sharp drop in this indicator in the first half of the 90s. - for men by almost 6.2 years, for women - by 3.1 years - in the last two years, life expectancy began to increase, and rather quickly. Only for three years, 1995-1997, it increased by 3.3 years for men and by 1.6 years for women. Perhaps this is not a short-term fluctuation of the wave, but the beginning of a new trend, evidence of our people overcoming the state of shock and adapting it to the new economic and social realities of life. Nevertheless, the average life expectancy of our population remains relatively low compared to most economically developed countries and even a number of developing countries (see table 6.6).
In 1995, out of 196 countries for which the UN calculates life expectancy (or receives data from countries), Russia ranked 140th in terms of male life expectancy and 100th in terms of female life expectancy. Such a lag cannot be justified by any "objective" reasons.
Table 6.6 Average life expectancy population (for newborns) in Russia and selected countries of the world in 1997
|
Countries |
Infant mortality rate, ‰ |
Average life expectancye 0 |
Difference (years) |
||
|
Men |
Women |
||||
|
Great Britain | |||||
|
Germany | |||||
|
Costa Rica | |||||
|
Argentina | |||||
|
South Korea | |||||


